Jump to a step
The video has no sound: the captions on screen explain each step, and every step is written out below with a picture.
- 1
Open Reports
Open Reports under Analytics. Choose 7d, 30d or 90d at the top.
- 2
The headline figures
The cards show Revenue, Orders, the Average order, Customers, those New this period and Repeat buyers.
- 3
Charts
Below: revenue day by day, Best sellers by revenue, Orders by status, and the Storefront funnel — page views, product views, added to cart and checkouts started.
- 4
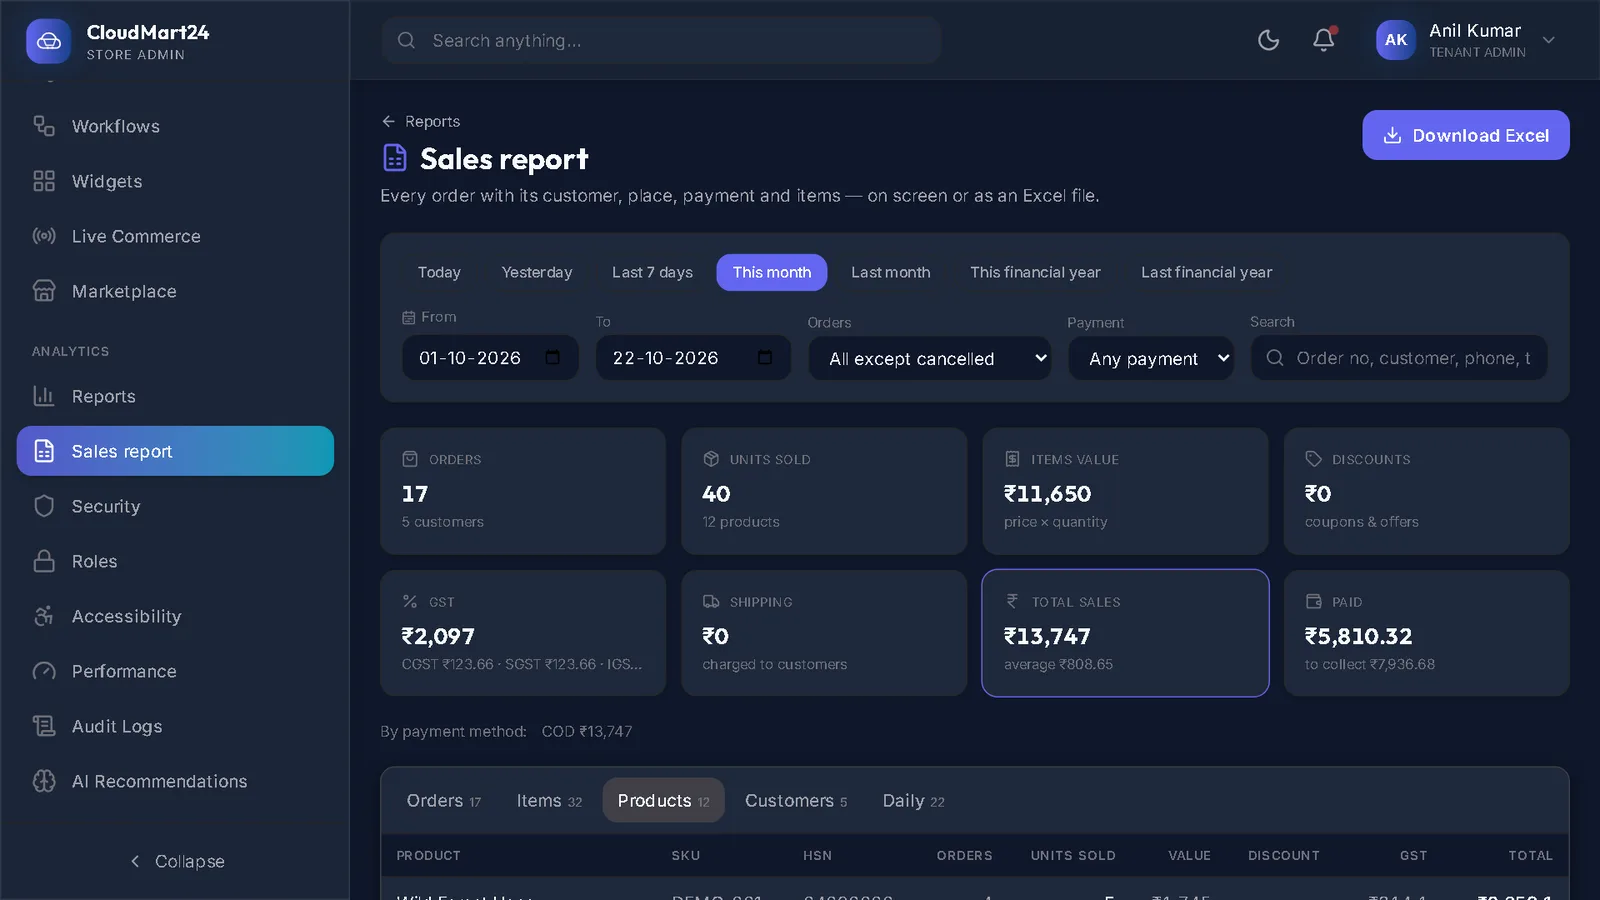
The full sales report
Sales report & Excel opens the order-by-order report — see Download the sales report in Excel.
Stuck on a step?
Book a short call and we will walk through it with your own shop on screen. Book a call